RECENT TRANSACTIONS
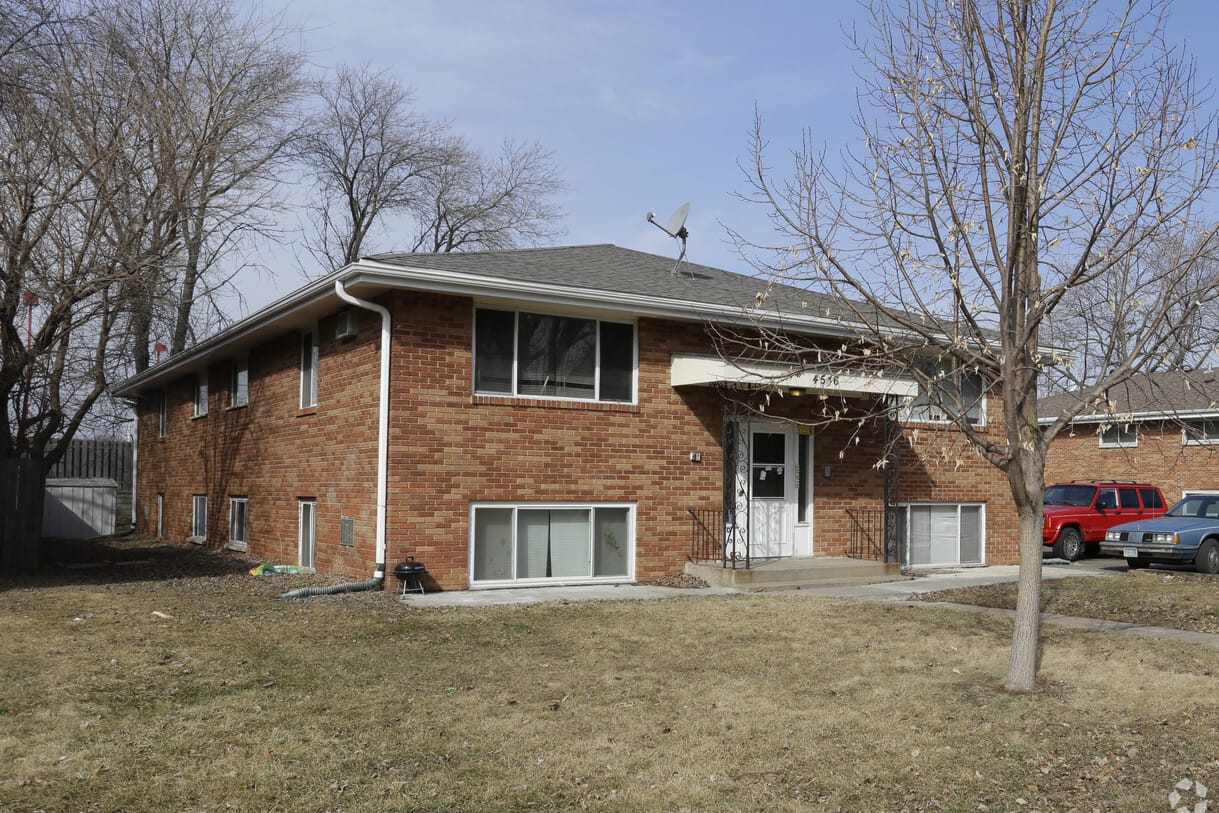
4546 Tyler Street NE

4546 Tyler Street Northeast, Minneapolis, MN 55421
Image Source: Apartments.com
Units | 8 |
Year of Construction | 1961 |
Sale Date | 5/2/2024 |
Price | $639,000 |
Price Per Unit | $79,875 |
eCRV ID |
ON MARKET
There are 110 listed multifamily properties on the market for a total of 2,956 units.

The table below shows a breakdown of the current on-market inventory by unit count.
Unit Count | < 10 | 10-19 | 20-49 | 50+ |
|---|---|---|---|---|
Assets | 49 | 34 | 15 | 12 |
Units | 293 | 426 | 469 | 1,768 |
Sources: We track on-market inventory through 3rd party listing services including Crexi, Loopnet, CoStar, Yardi, and RCM Marketplace. We also source data from NorthstarMLS and NAR RPR. Data are deemed to be reliable, but not guaranteed.
NEWS
Brooklyn Park Project Could Be a Case Study for Prevailing Wage: LINK
Highland Bridge Housing Projects Open in St. Paul: LINK
Transformed Schurmeier Lofts in St. Paul sold for $9.3M: LINK
Property Taxes a Major Focus of Frey Address: LINK
Just Sold: Emergency Shelter Adds Apartments: LINK
TWIN CITIES ECONOMY
Minneapolis-St. Paul-Bloomington, MN-WI
Labor Force (thousands) | 2,023.2 |
Monthly Change | +0.0% |
Unemployment Rate | 3.0% |
Monthly Change | -0.4% |
Minneapolis MSA Inflation | 2.7% |
Change since Jan 2024 | +0.1% |
National Inflation | 3.5% |
Data as of Mar 2024
Source: U.S. Bureau of Labor Statistics
Housing Inventory
Metric | Number | YoY Change |
|---|---|---|
Sales Price | $375,000 | +2.2% |
Months Supply | 2.0 | +25.0% |
Days on Market | 17.0 | +13.3% |
Dollar Volume | $17.1B | -7.4% |
Showings/Listing | 5.7 | -5.0% |
Price/SF | $197 | +2.1% |
Data Based on 7-County MSP Metro: Anoka, Carver, Dakota, Hennepin, Ramsey, Scott, and Washington counties.
Dated April 2024
Source: InfoSparks
RATES AND STATS
Treasury Yield Curve
Date | 1 Year | 5 Year | 10 Year | 30 Year |
|---|---|---|---|---|
5/10 | 5.17% | 4.52% | 4.50% | 4.64% |
5/3 | 5.12% | 4.48% | 4.50% | 4.66% |
Change | +0.05% | +0.04% | +0.00% | -0.02% |
Status: Yield curve continues to be inverted
Source: Treasury.gov
Source: Wall Street Journal
SOFR
Date | Rate |
|---|---|
5/9 | 5.31% |
5/3 | 5.31% |
Change | +0.00% |
Source: New York Fed
FINANCIAL MARKETS
Stock Indexes
Index | Quote | 5-Day Change |
|---|---|---|
Dow Jones | 39,513 | +2.16% |
S&P 500 | 5,223 | +1.85% |
Nasdaq | 16,341 | +1.14% |
Source: Wall Street Journal
Consumer Rates
Index | Quote | YoY Change |
|---|---|---|
Money Market | 0.48% | -0.05% |
5-Year CD | 2.84% | +0.03% |
30-Year Mortgage | 7.54% | +0.54% |
15-Year Mortgage | 6.96% | +0.66% |
5-Year ARM | 6.69% | +0.96% |
New-Car Loan | 7.83% | +0.80% |
Source: Wall Street Journal
CONTACT US
I hope you enjoyed this update.
Have any questions?
Want to learn about our current listings?
Considering a sale of your property?
Drop us a line today.
Twitter: @David_J_Wallace
LinkedIn: @David-J-Wallace
Website: www.mfirealtyadvisors.com
Email: [email protected]
Phone: (612) 524-9483
NOTICE
The content of this email is intended for the person or entity to which it is addressed only. This email may contain confidential information. If you are not the person to whom this message is addressed, you must not review, retransmit, print, copy, use or disseminate it. Please immediately notify us by return e-mail and delete it. If this e-mail contains a forwarded e-mail or is a reply to a prior email, the contents may not have been produced by the sender and therefore we are not responsible for its contents.
Data presented are deemed to be accurate, but not guaranteed. The information provided is not intended to replace or serve as a substitute for any legal, accounting, investment, real estate, tax or other professional advice, consultation, or service. The user of this information should consult with a professional in the respective legal, accounting, tax, or other professional area before making any decisions.

